Sales Analyst Resume Examples: free ATS score and gap list
Sales Analyst Resume for Reporting, Forecasting and Insight
By Mustafa Tarabya, founder of CVBooster · Published · Updated
Sales analyst resume examples with forecasting, SQL and dashboard bullets, plus the keywords and structure hiring managers look for.
Sample resumes for a sales analyst
The same sales analyst content laid out in three CVBooster templates, so you can see what the finished document looks like before you write a word.
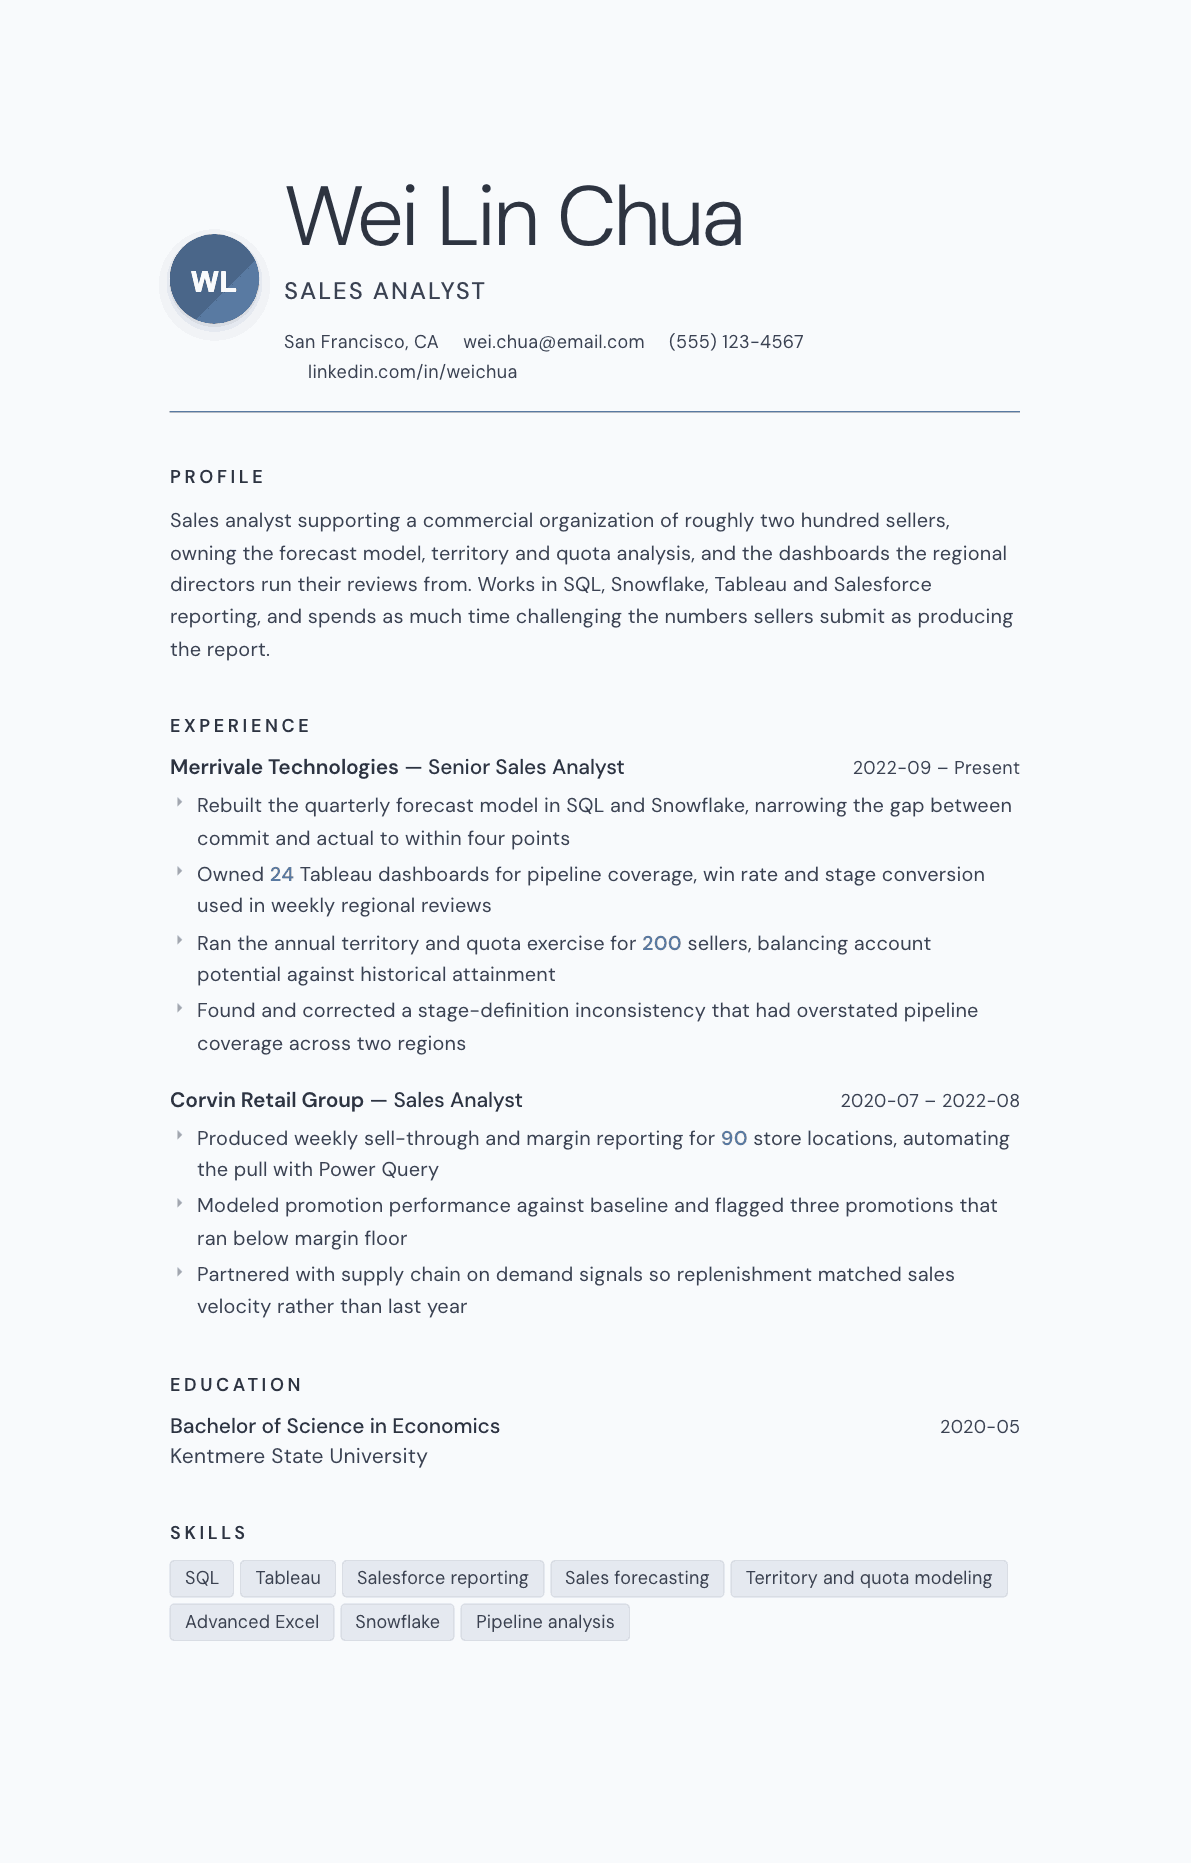
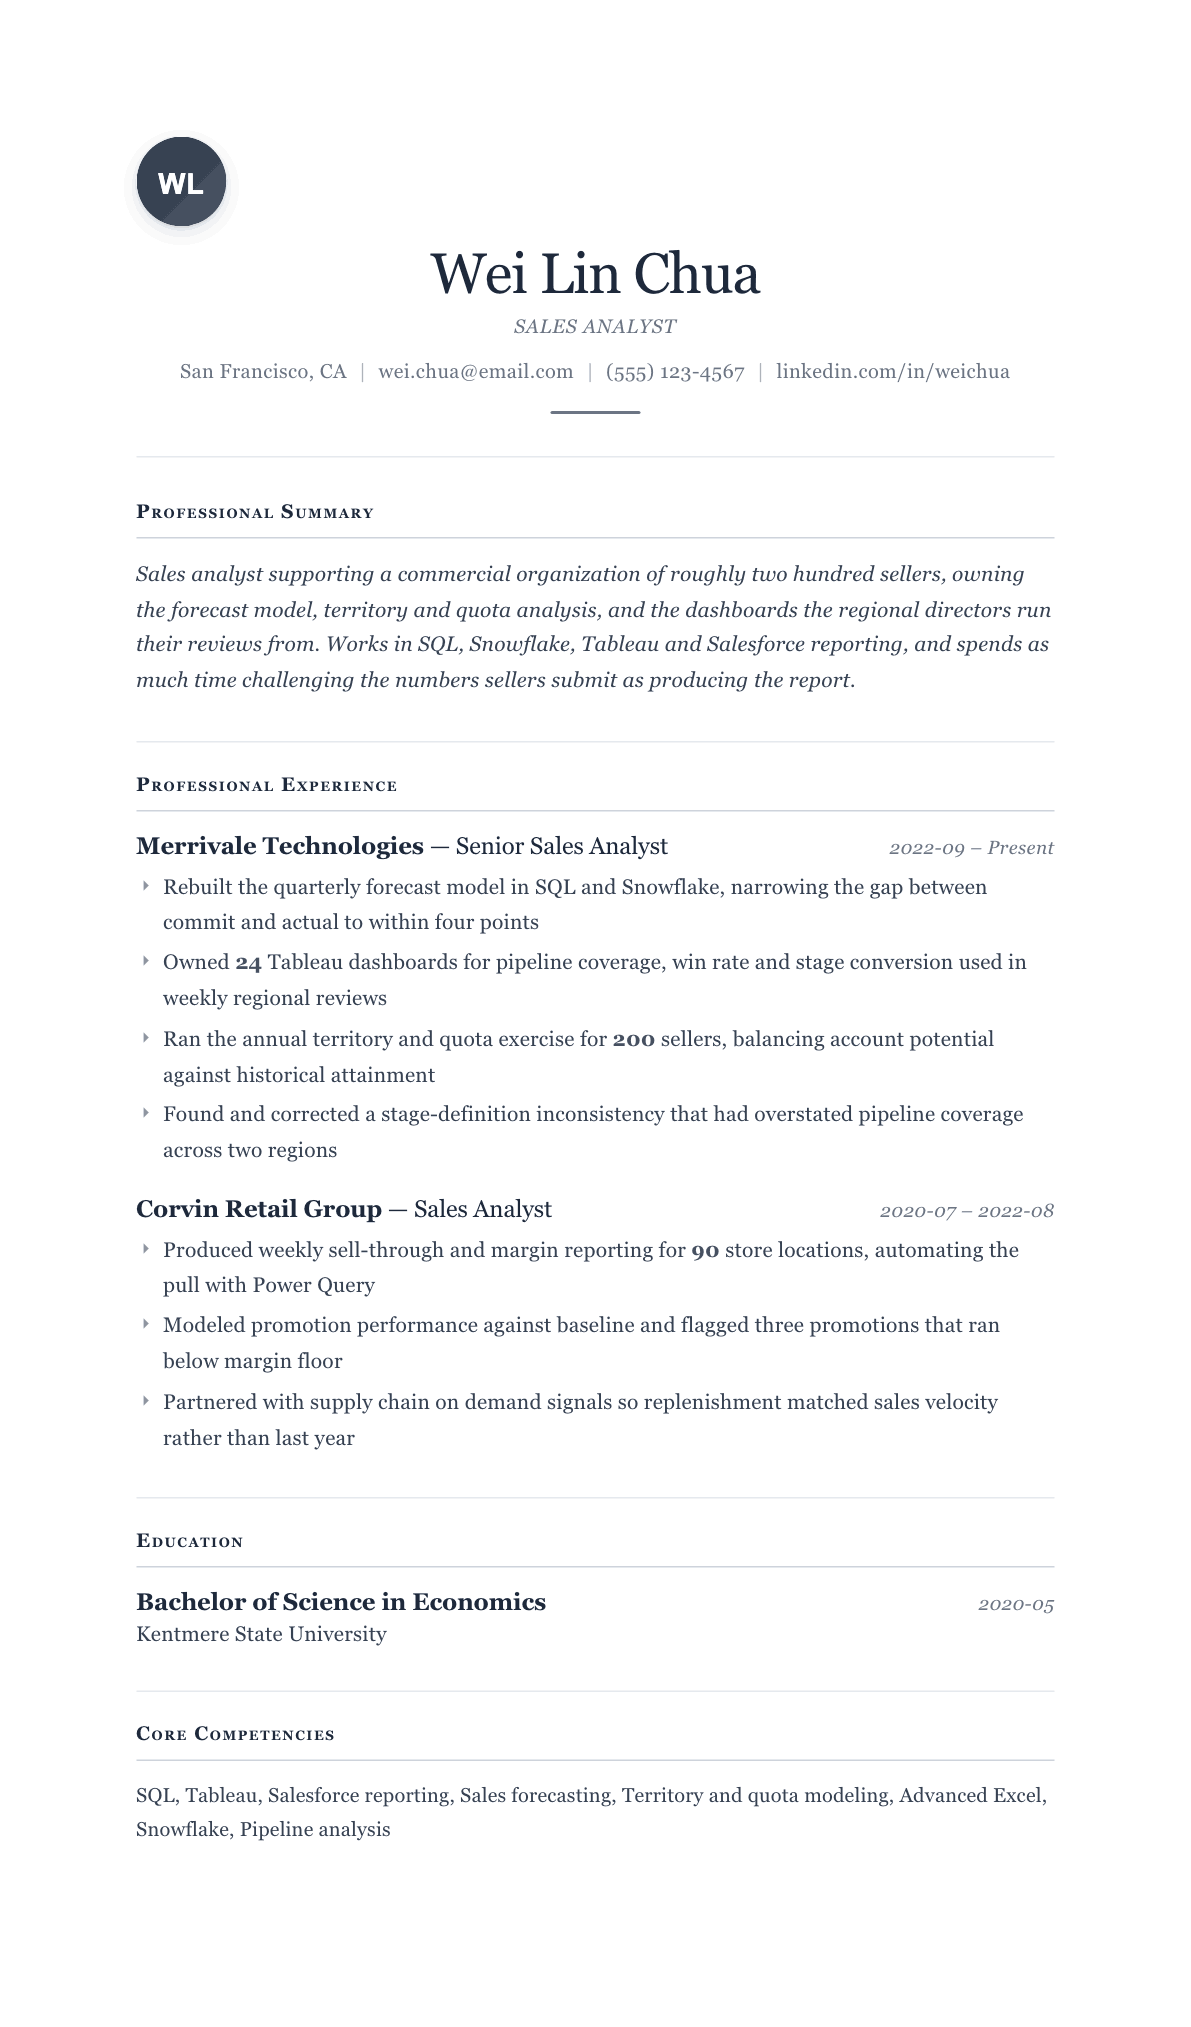
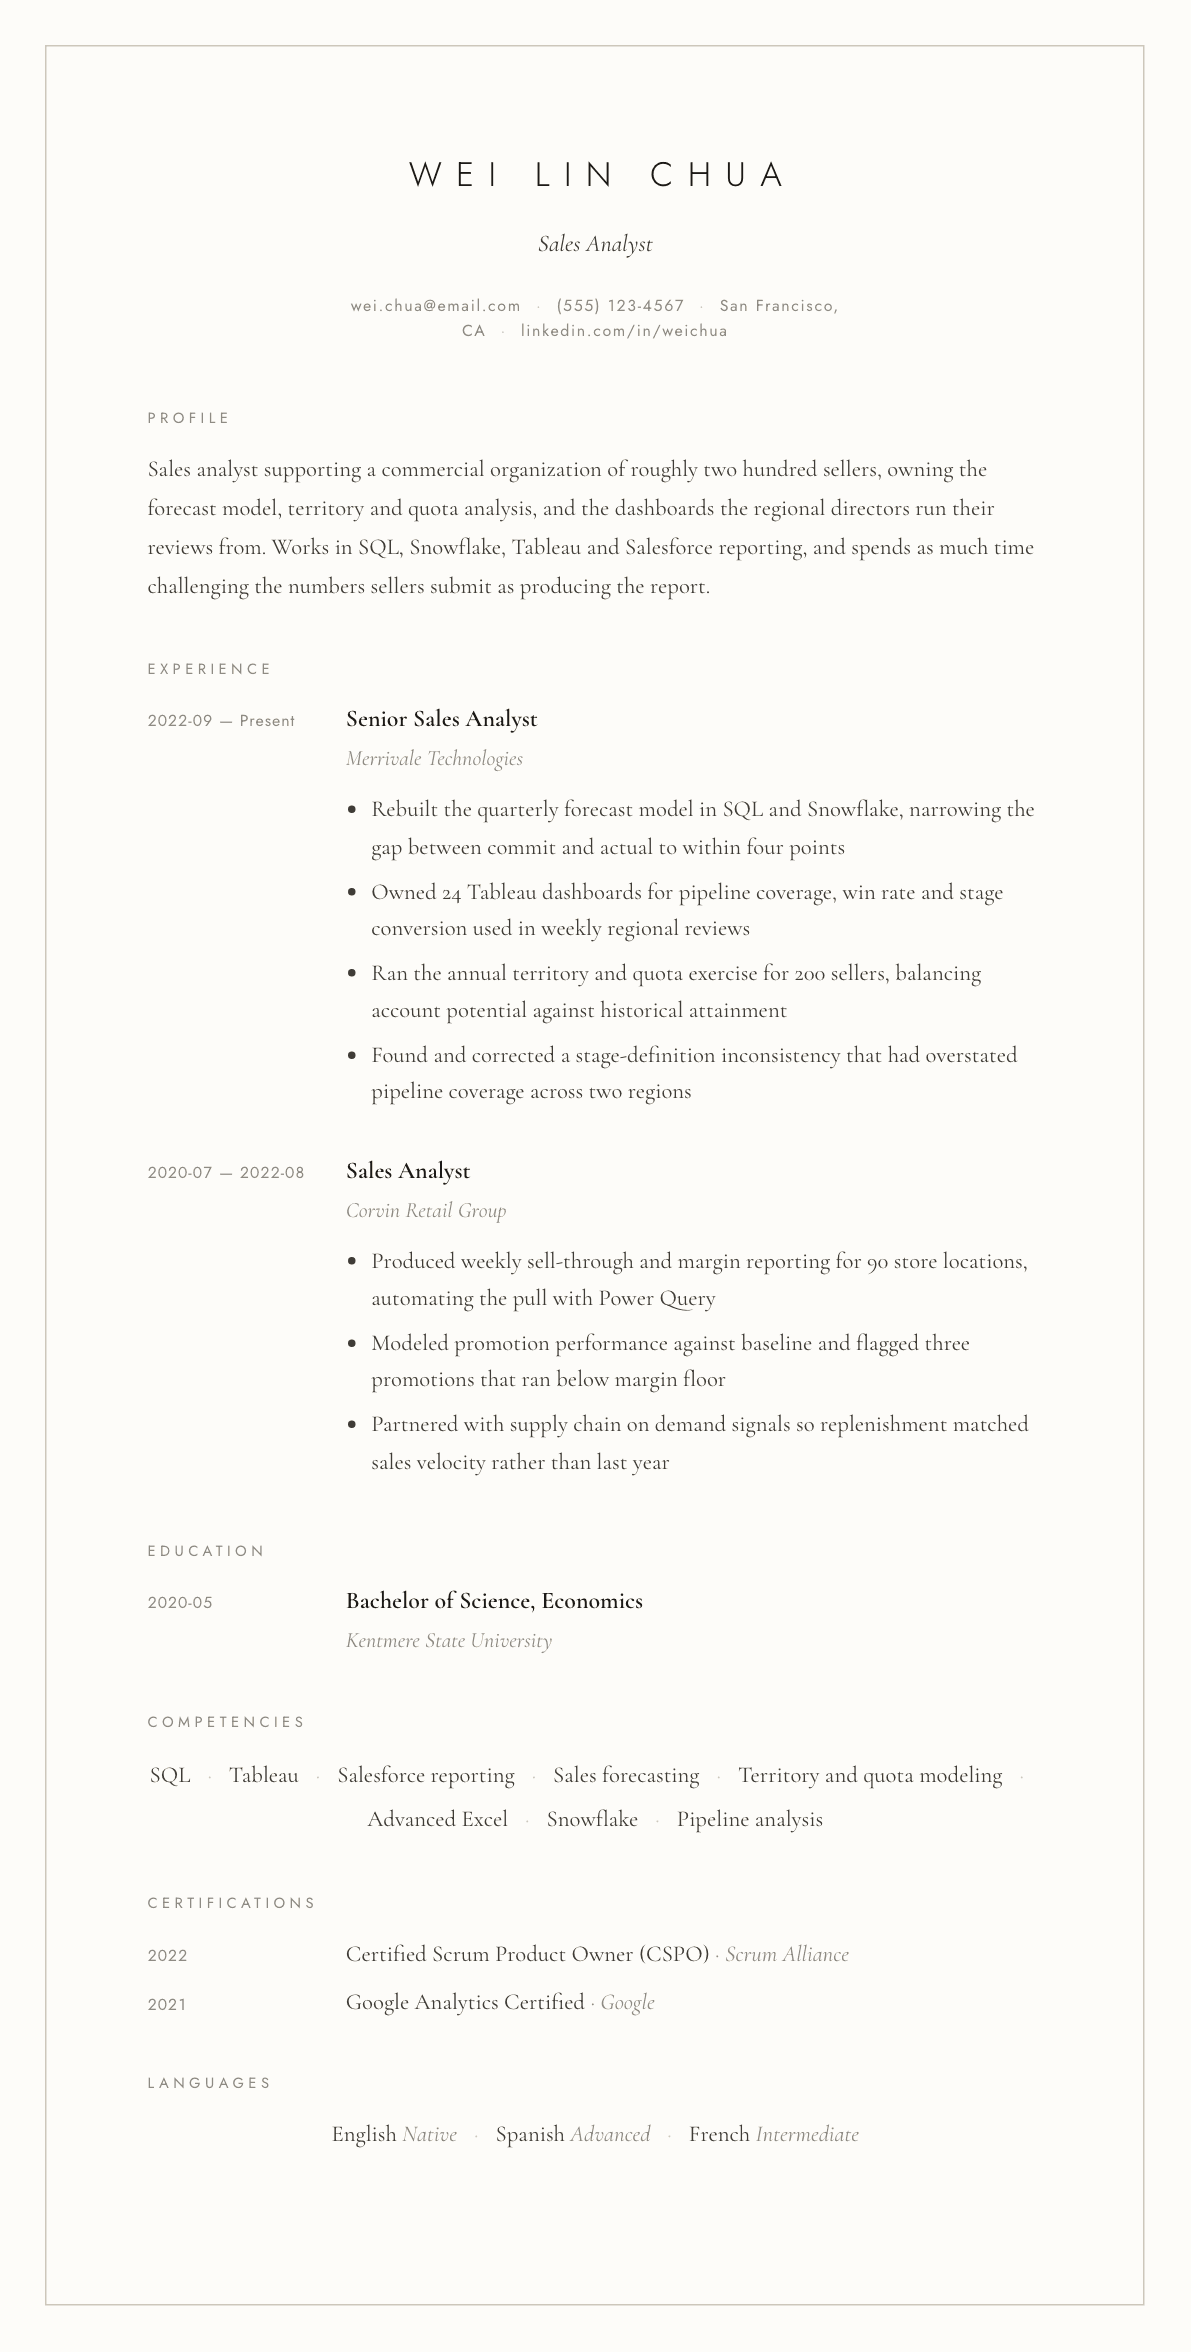
Example Sales Analyst summary
Sales analyst with five years supporting commercial teams of up to two hundred sellers, owning the forecast model, the territory and quota exercise, and two dozen Tableau dashboards used in regional reviews. Rebuilt a quarterly forecast in SQL and Snowflake that narrowed the commit to actual gap to within four points, and found a stage-definition error that had overstated pipeline coverage.
Skills to list on a Sales Analyst resume
- SQL
- Advanced Excel
- Tableau
- Power BI
- Snowflake
- Salesforce reporting
- Sales forecasting
- Pipeline and funnel analysis
- Territory and quota modeling
- Win rate and stage conversion
- Commission and incentive analysis
- Data validation and reconciliation
- Dashboard design
- Python for analysis
What actually gets this resume read
- Put the tooling line high on the page: SQL, Excel, Tableau, Power BI, Snowflake, Salesforce, because that is the first filter.
- Frame each project as a decision the analysis changed, not as a report you produced on a schedule.
- Show the size of the commercial organization you supported, since forecasting for two hundred sellers is a different job.
- Include forecast accuracy, pipeline coverage or win-rate work, the three analyses every sales leadership team asks for.
- Mention the data you had to clean or reconcile, because most of the role is arguing with imperfect CRM records.
- Keep the resume in one column with plain section headings so the numbers stay readable after an ATS parses it.
How to write a sales analyst resume
A sales analyst resume is read by two people with different tests. A sales operations manager checks whether you can build the forecast, the territory model and the dashboards without supervision. A data or analytics lead checks whether your SQL is real. Both of them are also quietly asking a third question: can this person tell a regional director that the number he just submitted is wrong, and survive the conversation.
That third question is the one most candidates never answer on paper. Sales analysis is not reporting. Sales data is entered by people whose pay depends on how it looks, in a system nobody maintains, against stage definitions that drift between regions. The value of the analyst is in the challenge, the reconciliation and the correction, not in the refresh.
This guide covers how to structure the resume around decisions rather than deliverables, how to present the tooling stack so it passes both screens, which analyses to lead with, and how to write about the data quality work that is most of the job and almost never appears on a resume.
Tools first, because that is the first filter
Put a compact technical block near the top: SQL and which dialect, the warehouse, the visualization tool, spreadsheet depth, the customer relationship system and its reporting layer, and any scripting. Snowflake, BigQuery, Redshift, Tableau, Power BI, Looker, Salesforce reporting, Excel with Power Query, Python with pandas.
Separate what you write from what you read. Writing window functions against a warehouse is a different claim from opening a saved report, and both an operations manager and an analytics lead will test the top three items in the interview.
Keep the block to plain text in one column. Skill bars and rating dots communicate nothing measurable and break when a tracking system parses the file.
- Query language and warehouse, stated by name.
- Visualization tool and how many dashboards you owned.
- Customer relationship system and its reporting or object model.
- Spreadsheet depth: lookups, pivots, Power Query, macros.
Frame every project as a decision, not a deliverable
A dashboard is not an achievement. The achievement is what somebody did differently after reading it. Write the bullet as the analysis, the finding and the decision: a stage-definition inconsistency found across two regions, corrected, and pipeline coverage restated so leadership stopped planning against an inflated number.
The same shape works for promotion analysis, discount leakage, churn drivers, territory imbalance and rep productivity. Analysis, finding, decision, consequence. If a bullet stops at the deliverable, a hiring manager reads a report writer.
Include at least one analysis that produced an uncomfortable answer. Analysts who only ever confirm the plan are not trusted with the forecast.
The core four analyses to lead with
Sales leadership asks for the same handful of analyses everywhere, so show that you own them. Forecasting and forecast accuracy. Pipeline coverage and funnel conversion by stage. Win rate cut by segment, product, rep and competitor. Territory and quota design.
For forecasting, name the method and the accuracy you achieved: a weighted pipeline model, a bottom-up commit rollup, a cohort-based model on historical conversion. Give the gap between commit and actual as a band rather than a claim of precision.
For territory and quota, give the number of sellers covered and the constraint you balanced: account potential against historical attainment, travel against coverage, fairness against continuity. This is the analysis that generates the most political heat and the most credibility when done well.
Data quality: the part nobody writes down
Say plainly that you own the reconciliation. Deduplicating accounts, enforcing stage-exit criteria, reconciling booked revenue against the finance system, chasing missing close dates, defining what counts as a qualified opportunity. Employers reading this recognize their own mess and move you up the pile.
Where you built controls rather than fixes, say so. A validation rule, a data quality dashboard, an exception report that goes to managers weekly. Controls scale, cleanups do not.
Scope and audience
State the size of the commercial organization you supported and who consumed your work. Producing weekly numbers for three regional managers is a different job from running the quarterly business review pack for a leadership team, and the reader cannot infer it.
Add a line on how you present. Analysts who can defend a number in front of a room of sales directors are promoted; analysts who send a file are not. One bullet on the review you run is enough to make the point.
Sales Analyst resume summary examples
First analyst role
Economics graduate with a year producing weekly sell-through and margin reporting for 90 store locations, automating the data pull with Power Query. Comfortable in SQL and Excel, and used to reconciling store submissions against the finance ledger before anything is published.
Three years in sales operations
Sales analyst supporting a commercial team of roughly two hundred sellers. Owns the quarterly forecast model in SQL and Snowflake, 24 Tableau dashboards used in weekly regional reviews, and the annual territory and quota exercise balancing account potential against historical attainment.
Lead analyst
Lead sales analyst owning forecasting, win rate analysis and incentive modeling for a multi-region organization. Narrowed the commit to actual gap to within four points, rebuilt stage definitions after finding an inconsistency that had overstated coverage, and presents the quarterly review pack to sales leadership.
Work experience bullets: before and after
Before: Built and maintained sales dashboards for the team.
After: Owned 24 Tableau dashboards covering pipeline coverage, win rate and stage conversion, used live in weekly regional reviews rather than distributed as a file nobody opened.
The count, the metrics and the consumption context show ownership of a decision surface, not report production.
Before: Improved the accuracy of the sales forecast.
After: Rebuilt the quarterly forecast in SQL on Snowflake using historical stage conversion instead of rep-weighted judgment, narrowing the gap between commit and actual to within four points.
The method change is named, so the accuracy improvement has a cause a reader can evaluate.
Before: Cleaned up data issues in the CRM.
After: Found a stage-definition inconsistency between two regions that had overstated pipeline coverage, restated the history and added an exception report so managers saw drift in the same week it happened.
A specific defect, the restatement and a control that prevents recurrence beat a generic cleanup claim.
Before: Helped with territory and quota planning.
After: Ran the annual territory and quota exercise for 200 sellers, balancing account potential against historical attainment and defending each carve-out to the regional director who owned it.
Scale plus the constraint plus the defense shows the political weight of the work, not just the modeling.
Before: Analyzed promotional performance for the retail business.
After: Modeled promotion performance against an unpromoted baseline across 90 stores and flagged three promotions running below the margin floor, two of which were withdrawn the following cycle.
The baseline, the finding and the action taken turn analysis into a business decision.
Hard skills
- SQL
- Snowflake and cloud warehouses
- Tableau
- Power BI
- Advanced Excel and Power Query
- Salesforce reporting and objects
- Sales forecasting models
- Pipeline and funnel analysis
- Win rate and stage conversion analysis
- Territory and quota modeling
- Incentive and commission analysis
- Python for data analysis
Soft skills
- Challenging a submitted number
- Explaining a model to non-analysts
- Skepticism about clean data
- Prioritizing among competing requests
- Presenting under scrutiny
- Documentation habits
Certifications worth listing
- Microsoft Certified: Power BI Data Analyst Associate (Microsoft)
- Tableau Desktop Specialist (Tableau)
- SnowPro Core Certification (Snowflake)
- Salesforce Certified Administrator (Salesforce)
Mistakes that cost sales analyst candidates the interview
- Listing dashboards built with no mention of what anyone decided differently as a result.
- Blurring the line between writing queries against a warehouse and running saved reports in a CRM.
- Leaving out the size of the sales organization you supported, which is how the scope is judged.
- Skipping the data reconciliation work, which is most of the job and the part employers relate to.
- Using skill rating bars instead of naming the tool and what you produced in it.
- Presenting only analyses that confirmed the plan, which reads as an analyst nobody could rely on.
Sales Analyst resume questions
Does a sales analyst need to know SQL?
For most roles above the entry level, yes. Even where reporting tools do the heavy lifting, the analyst is expected to validate what those tools return against the warehouse. State the dialect you write and be ready for a live exercise on joins and window functions.
What is the difference between a sales analyst and a sales operations analyst?
Sales analyst leans toward reporting, forecasting and insight. Sales operations analyst usually adds process and system ownership: territory loading, quota administration, CRM configuration and workflow. Many postings combine both, so read the responsibilities instead of the title.
What should a sales analyst resume put first?
A compact technical block naming the query language, warehouse, visualization tool, CRM and spreadsheet depth, followed by a summary that gives the size of the commercial organization you supported. Those two blocks pass the first screen from both operations and analytics readers.
How do I show business impact as an analyst rather than output?
Write each bullet as analysis, finding, decision and consequence. Name the thing that changed after your work: a promotion withdrawn, a forecast method replaced, a territory rebalanced, a stage definition corrected. Output without a decision reads as report maintenance.
Should a sales analyst include a portfolio or work samples?
A short link to anonymized dashboard screenshots or a public data project helps, especially early in a career. Never include real customer or revenue data. Describe the model and the method in the resume and keep the proof for the technical interview.