HR Data Analyst Resume Examples: the lines they read
Build an HR Data Analyst Resume That Proves Your Numbers
By Mustafa Tarabya, founder of CVBooster · Published · Updated
An HR data analyst resume example with people metrics, SQL and dashboard bullets, the keywords ATS filters catch, and a section-by-section guide.
Sample resumes for a hr data analyst
The same hr data analyst content laid out in three CVBooster templates, so you can see what the finished document looks like before you write a word.
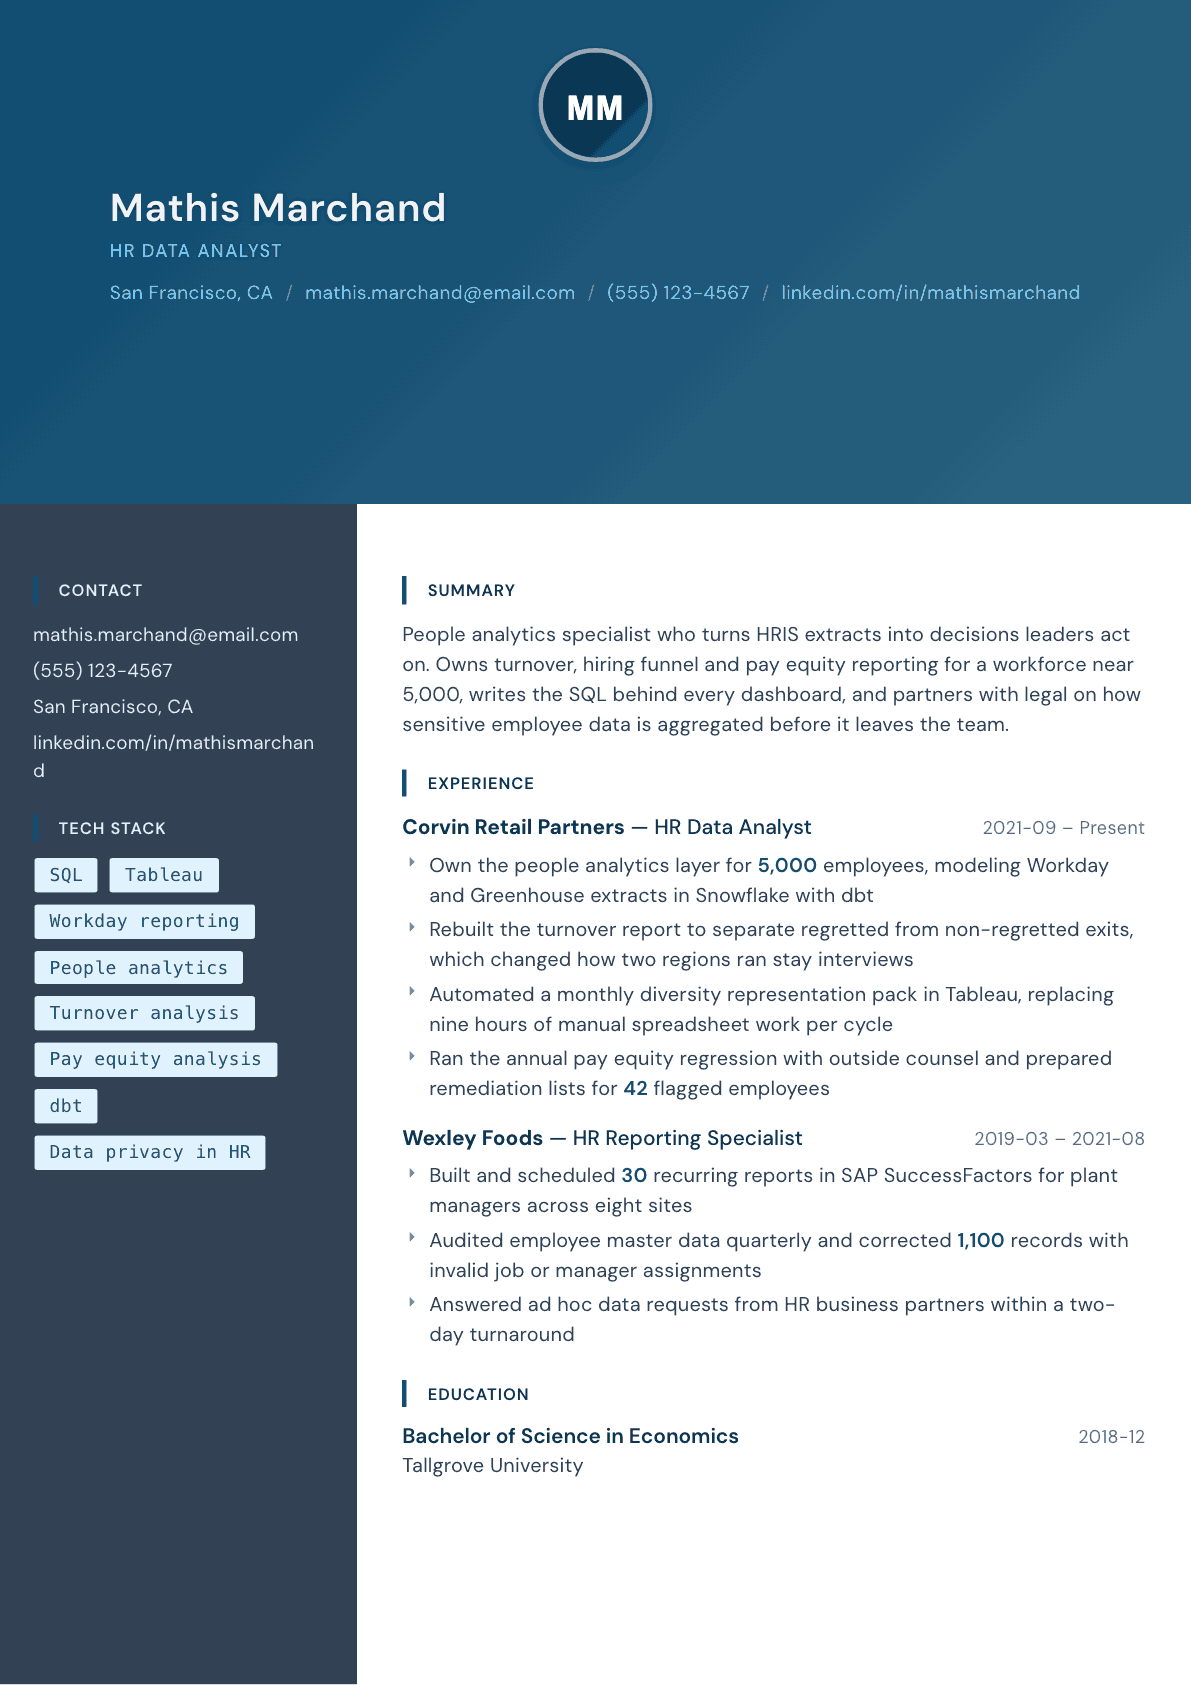
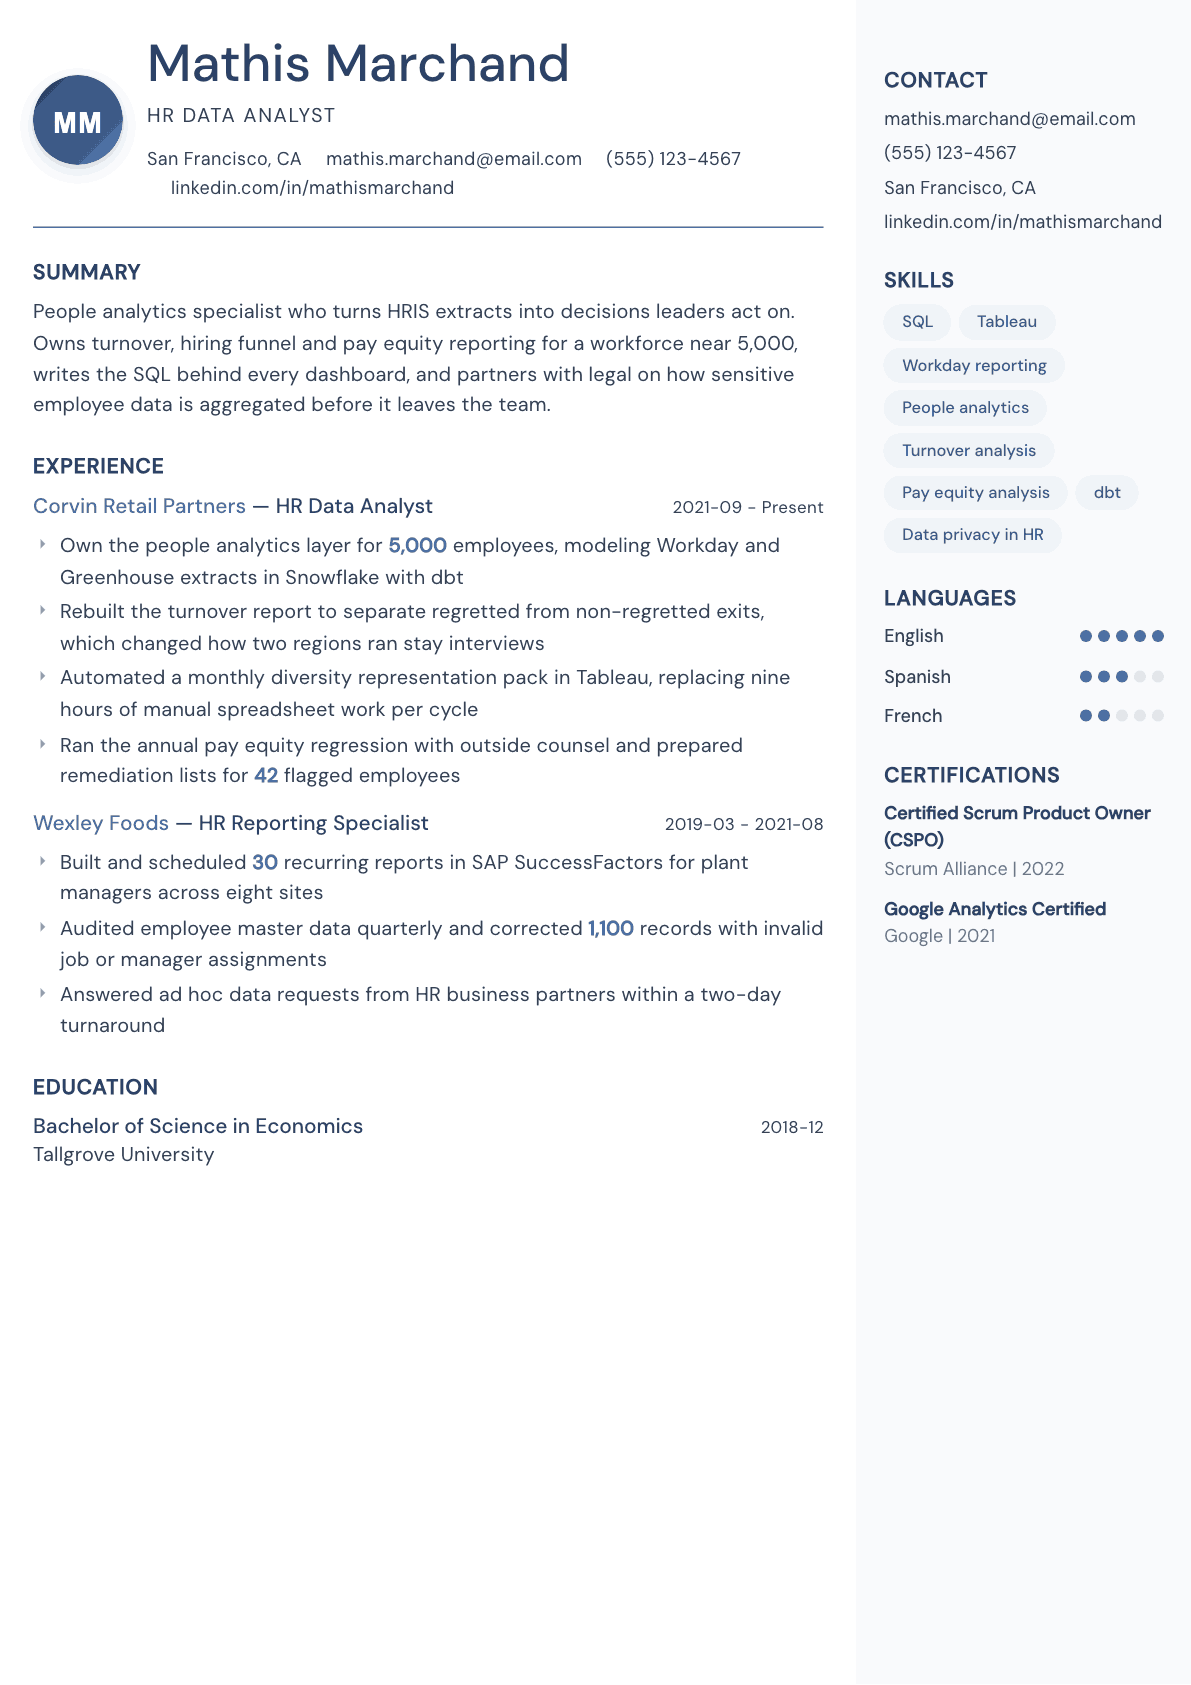
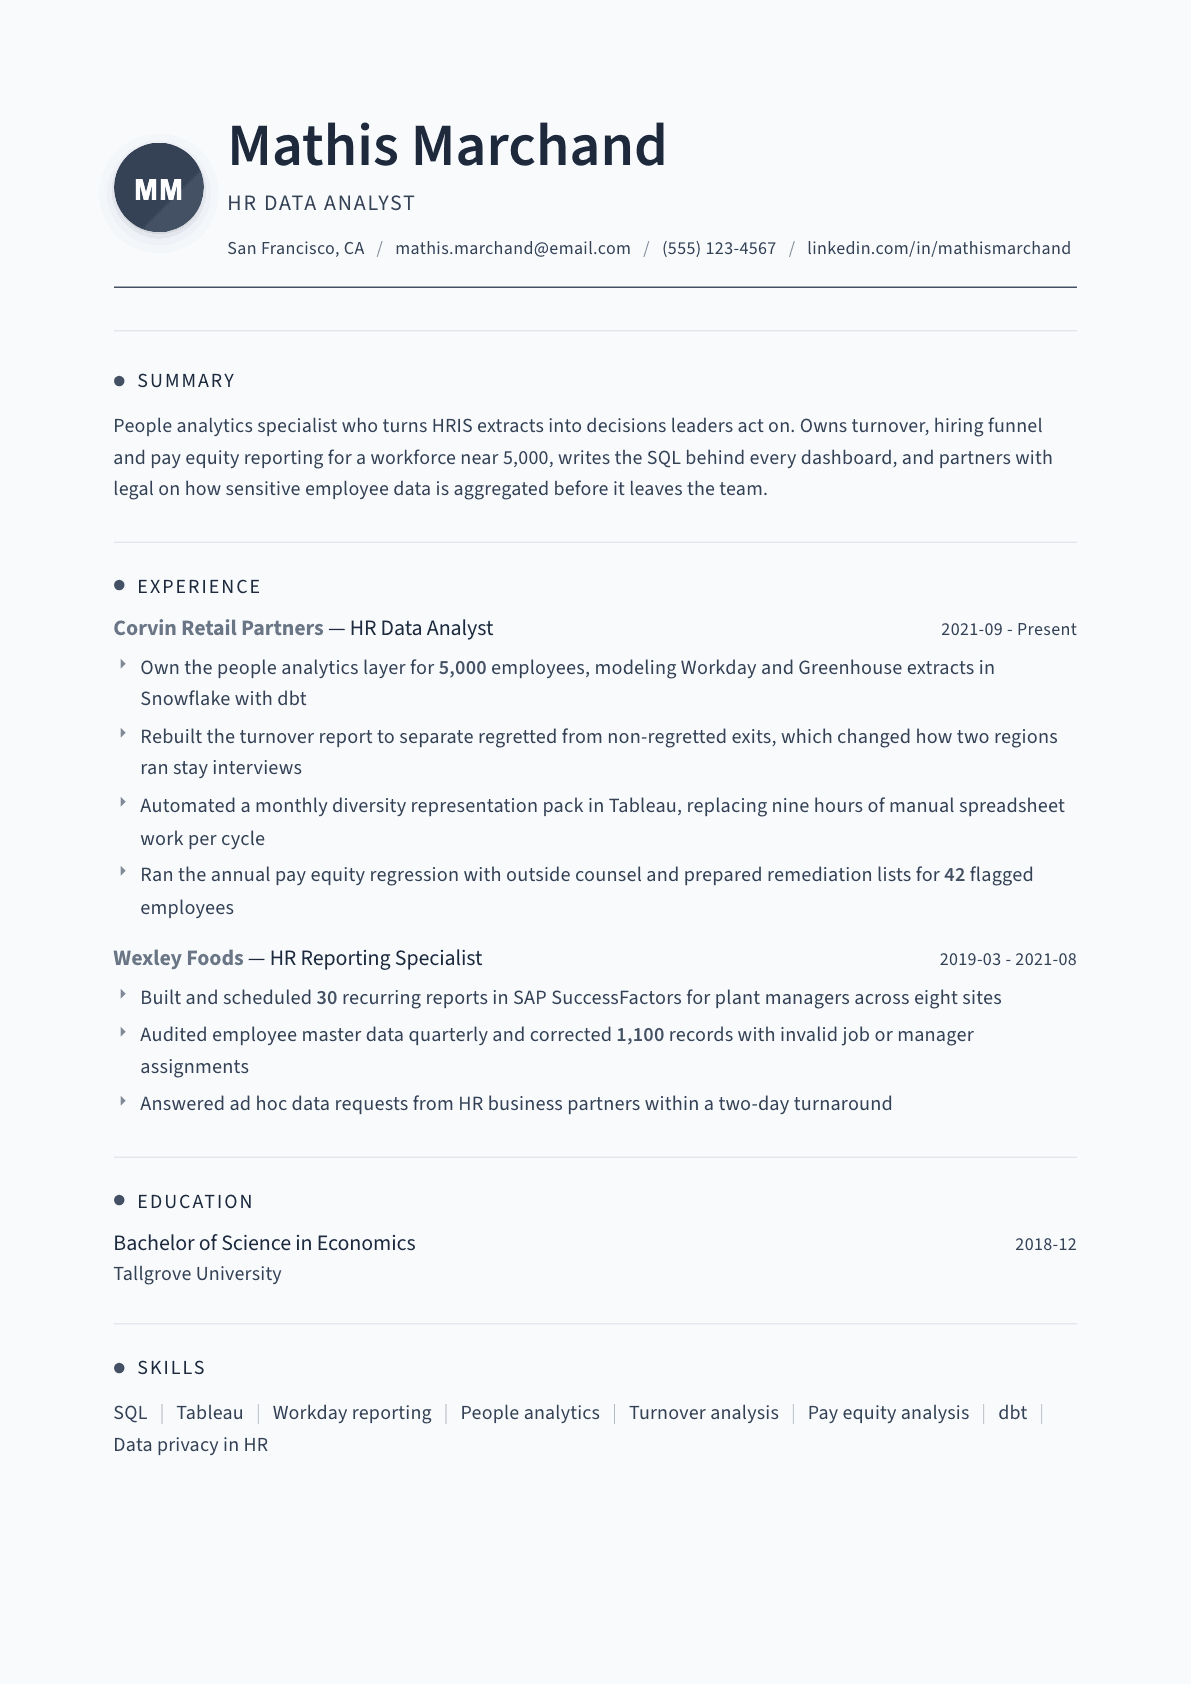
Example HR Data Analyst summary
HR data analyst with six years turning HRIS extracts into people metrics leaders trust. Owns turnover, hiring funnel and pay equity reporting for a workforce of about 5,000, writes the SQL and dbt models behind every dashboard, and delivers the monthly executive pack in Tableau. Known for separating regretted from non-regretted attrition so retention work targets the exits that hurt.
Skills to list on a HR Data Analyst resume
- SQL
- Python for analysis
- Tableau
- Power BI
- Workday HCM
- SAP SuccessFactors
- Snowflake
- dbt
- People analytics
- Turnover and retention analysis
- Hiring funnel metrics
- Pay equity analysis
- Survey analysis
- Data visualization
- HR data governance
What actually gets this resume read
- Lead with the data stack: the HRIS, the warehouse, the query language and the visualization tool, in that order.
- Name the people metrics you own by their real names: regretted attrition, time to fill, quality of hire, internal mobility rate.
- Show one analysis that changed a decision, not just a dashboard you built and handed over to someone else.
- Mention how you handle sensitive fields, because employee data governance is what separates this role from general analytics.
- Quantify the reporting load you removed: hours of manual work, number of recurring reports, or requests closed per month.
- Keep tool names spelled the way postings spell them so the applicant tracking system matches Workday, SuccessFactors or Greenhouse.
How to write a hr data analyst resume
An HR data analyst sits between a messy employee database and a leadership team that wants a straight answer about why people are leaving. The resume has to prove both halves. A people analytics lead reads it looking for real technical depth, because most applicants can filter a spreadsheet and very few can model a hiring funnel correctly. An HR director reads the same page looking for someone who will not embarrass the function by publishing a number that turns out to be wrong.
What makes this role different from any other analyst job is the data itself. Employee records are sensitive, small populations break anonymity, and a pay analysis can create legal exposure. The screener is watching for whether you understand that, and a resume that treats HR data like ordinary business data reads as inexperienced no matter how good the SQL is.
This guide covers the stack you should name, the people metrics worth listing, how to write bullets that show an analysis changed a decision, and the credential and education questions that come up most often.
Format: one page, technical block near the top
Use reverse-chronological order and put a compact technical block directly under the summary. The people analytics reader wants to know within seconds whether you write SQL, which HRIS you extract from and which visualization tool you publish in. Burying that under three jobs costs you the screen.
Keep the layout simple and avoid graphics that show skills as filled bars. An analytics resume that rates your own SQL out of five invites a question you do not want to answer, and many HR parsers drop the graphic entirely.
- Header: name, city and state, phone, email, and a link to work only if it contains no real employee data.
- Section order: summary, technical skills, experience, education, certifications when you hold one.
- Analysts moving in from a business intelligence team should name the HR domains they have already worked in.
Summary: population, metrics owned, stack, one analysis
Three or four lines. Give the workforce size you report on, the metrics you own end to end, the tools you build in, and one analysis that changed something. That structure answers scope, depth and impact before the reader reaches your first employer.
If your work is mostly reporting rather than analysis, say so honestly and lead with volume and reliability instead. Reporting specialists who claim to be modelers get caught quickly, and a well-run reporting function is a respected background for this role.
Experience: name the metric, the cut, and what moved
Write bullets around named people metrics rather than around tools. Regretted and non-regretted attrition, time to fill, time to accept, offer acceptance rate, internal mobility, quality of hire, span of control, absence rate and pay gap analysis are the vocabulary of this field. Each one implies a definition, and using them correctly is itself a signal.
For at least two bullets per job, follow the metric with the cut that revealed something: by tenure band, by manager, by pay quartile, by hiring source, by location. The cut is where analysis begins. Reporting a company turnover number is a task, and showing that first-year exits drove most of it is analysis.
Include one bullet per job on the pipeline itself: the extracts, the transformation layer, the refresh schedule, and what you automated. People analytics teams are usually small enough that the analyst also owns the plumbing.
- Say which systems the data comes from: the HRIS, the applicant tracking system, the survey platform, payroll.
- Mention how you handle small populations and sensitive fields, including minimum group sizes for reporting.
- Give the recurring load you carry: number of scheduled reports, ad hoc requests per month, turnaround time.
Technical skills: the stack in the order you use it
List source systems, then the warehouse and transformation layer, then the query and analysis languages, then the visualization tool. Workday, SAP SuccessFactors, Greenhouse, Qualtrics, Snowflake, dbt, SQL, Python or R, Tableau or Power BI. Spell the product names exactly as postings spell them.
Statistics deserve a line of their own when you have it. Regression for pay equity, survival analysis for attrition, and significance testing on survey results are the methods that separate a people analytics hire from a report writer. Only list a method you could explain in an interview.
Governance: the part most applicants leave out
Add one bullet somewhere on the page about how employee data is protected in your work: access restrictions on compensation fields, aggregation thresholds before results are published, working with legal or privacy on a sensitive analysis, or a retention rule you followed. It is short, it is rare on applicant resumes, and it reassures the reader that you can be trusted with the dataset.
HR Data Analyst resume summary examples
First analytics role
HR reporting analyst with two years supporting 1,200 employees, producing monthly turnover, headcount and hiring dashboards in Power BI from Workday extracts. Learning SQL on the job and rebuilt three manual spreadsheets into scheduled reports. Looking to move into a full people analytics team.
Five years in
People analytics specialist owning turnover, hiring funnel and pay equity reporting for a workforce near 5,000. Models Workday and applicant tracking data in Snowflake with dbt, publishes in Tableau, and separated regretted from non-regretted exits, which redirected retention spending toward two field roles.
Lead analyst
Senior people analytics lead for a global workforce of 12K, running the annual pay equity regression with counsel and the engagement analysis behind the executive scorecard. Built the HR data model three analysts now work in, and sets the aggregation rules that govern what leaves the team.
Work experience bullets: before and after
Before: Built HR dashboards for managers.
After: Built a manager-facing Tableau dashboard covering headcount, attrition and open requisitions for 5,000 employees, refreshed nightly from a dbt model over Workday extracts.
The audience, the population, the refresh and the source data turn a vague deliverable into something a reader can size.
Before: Reported on turnover every month.
After: Rebuilt monthly turnover reporting to split regretted from non-regretted exits by tenure band, revealing that first-year departures made up 46% of losses in two field organizations.
The redefinition and the cut show analytical judgment; the original bullet only shows that a report existed.
Before: Worked on pay equity analysis.
After: Ran the annual pay equity regression with outside counsel across nine job families, prepared the remediation list for review, and documented the model so it could be rerun the following cycle.
Naming the method, the partner and the reusable documentation shows this was owned rather than assisted with.
Before: Automated manual reporting.
After: Replaced nine hours of monthly spreadsheet work with a scheduled diversity representation pack, adding a minimum group size rule so no cell exposed an individual employee.
The time saved is concrete and the privacy rule proves the analyst understands what HR data can and cannot show.
Before: Answered data requests from HR business partners.
After: Closed roughly 25 ad hoc requests a month from HR business partners within two business days, and converted the six most repeated into self-service views.
Volume plus turnaround plus the move to self-service shows both service level and a bias toward removing the work.
Hard skills
- SQL
- Python or R for analysis
- Tableau
- Power BI
- Workday reporting
- SAP SuccessFactors
- Applicant tracking system data
- Snowflake or similar warehouse
- dbt or equivalent transformation layer
- Turnover and retention analysis
- Hiring funnel metrics
- Pay equity regression
- Survey and engagement analysis
- HR data governance and anonymization
Soft skills
- Translating a model into one sentence a director can repeat
- Discretion with sensitive employee data
- Questioning a number before publishing it
- Partnering with HR business partners
- Documenting method so others can rerun it
Certifications worth listing
- SHRM Certified Professional (SHRM-CP) (Society for Human Resource Management)
- Tableau Desktop Specialist (Tableau)
- Microsoft Certified: Power BI Data Analyst Associate (Microsoft)
- Workday Pro Reporting (Workday)
Mistakes that cost hr data analyst candidates the interview
- Listing tools without ever showing an analysis that changed a decision.
- Using turnover as a single number when the field expects it split by regretted status and tenure.
- Omitting the HRIS name, which is often the first filter applied to the applicant pool.
- Claiming statistical methods you could not defend in a fifteen minute technical conversation.
- Publishing portfolio work that contains recognizable employee data or unmasked salary bands.
- Writing bullets that would fit a marketing analyst just as well as a people analytics one.
- Ignoring data governance entirely, which reads as inexperience with employee records.
HR Data Analyst resume questions
Do I need an HR background to get hired as an HR data analyst?
No, but you need to show you understand the domain. Learn how turnover, time to fill and internal mobility are defined and where those definitions go wrong. One bullet using them correctly does more than a paragraph about your analytics background.
How technical do these roles get?
It varies widely. Some teams want a report builder inside the HRIS, others want a full data engineer who models employee data in a warehouse. Read the posting for the warehouse and transformation tools, and match your summary to the version of the job being advertised.
Can I show portfolio work when all my data is confidential?
Yes, if you rebuild it on public or synthetic data. Recreate an attrition survival model or a hiring funnel on a generated dataset and describe the method. Never publish anything derived from a former employer's employee records, even aggregated.
Should I include the size of the workforce I reported on?
Always. Population size sets the difficulty of nearly every analysis in this field, from whether attrition rates are stable enough to trend to whether a pay equity regression has enough observations per job family. Give the number in the summary and in each job.
Is a certification worth getting for this role?
A visualization or HRIS reporting certification is worth having because postings sometimes filter on it, and it is quick evidence for the tool. A general HR certification helps if you come from a technical background and need to show domain commitment.
Related resume examples
- HRIS Analyst Resume example
- Compensation Analyst Resume example
- Workforce Planning Analyst Resume example
- HR Analyst Resume example
- HR Administrator Resume example
- HR Operations Manager Resume example