Business Intelligence Analyst Resume Examples: free score
Write a Business Intelligence Analyst Resume That Shows Decisions Changed
By Mustafa Tarabya, founder of CVBooster · Published · Updated
Business intelligence analyst resume examples, including a Tableau resume written out, with dashboard and SQL wording and the reporting keywords to use.
Sample resumes for a business intelligence analyst
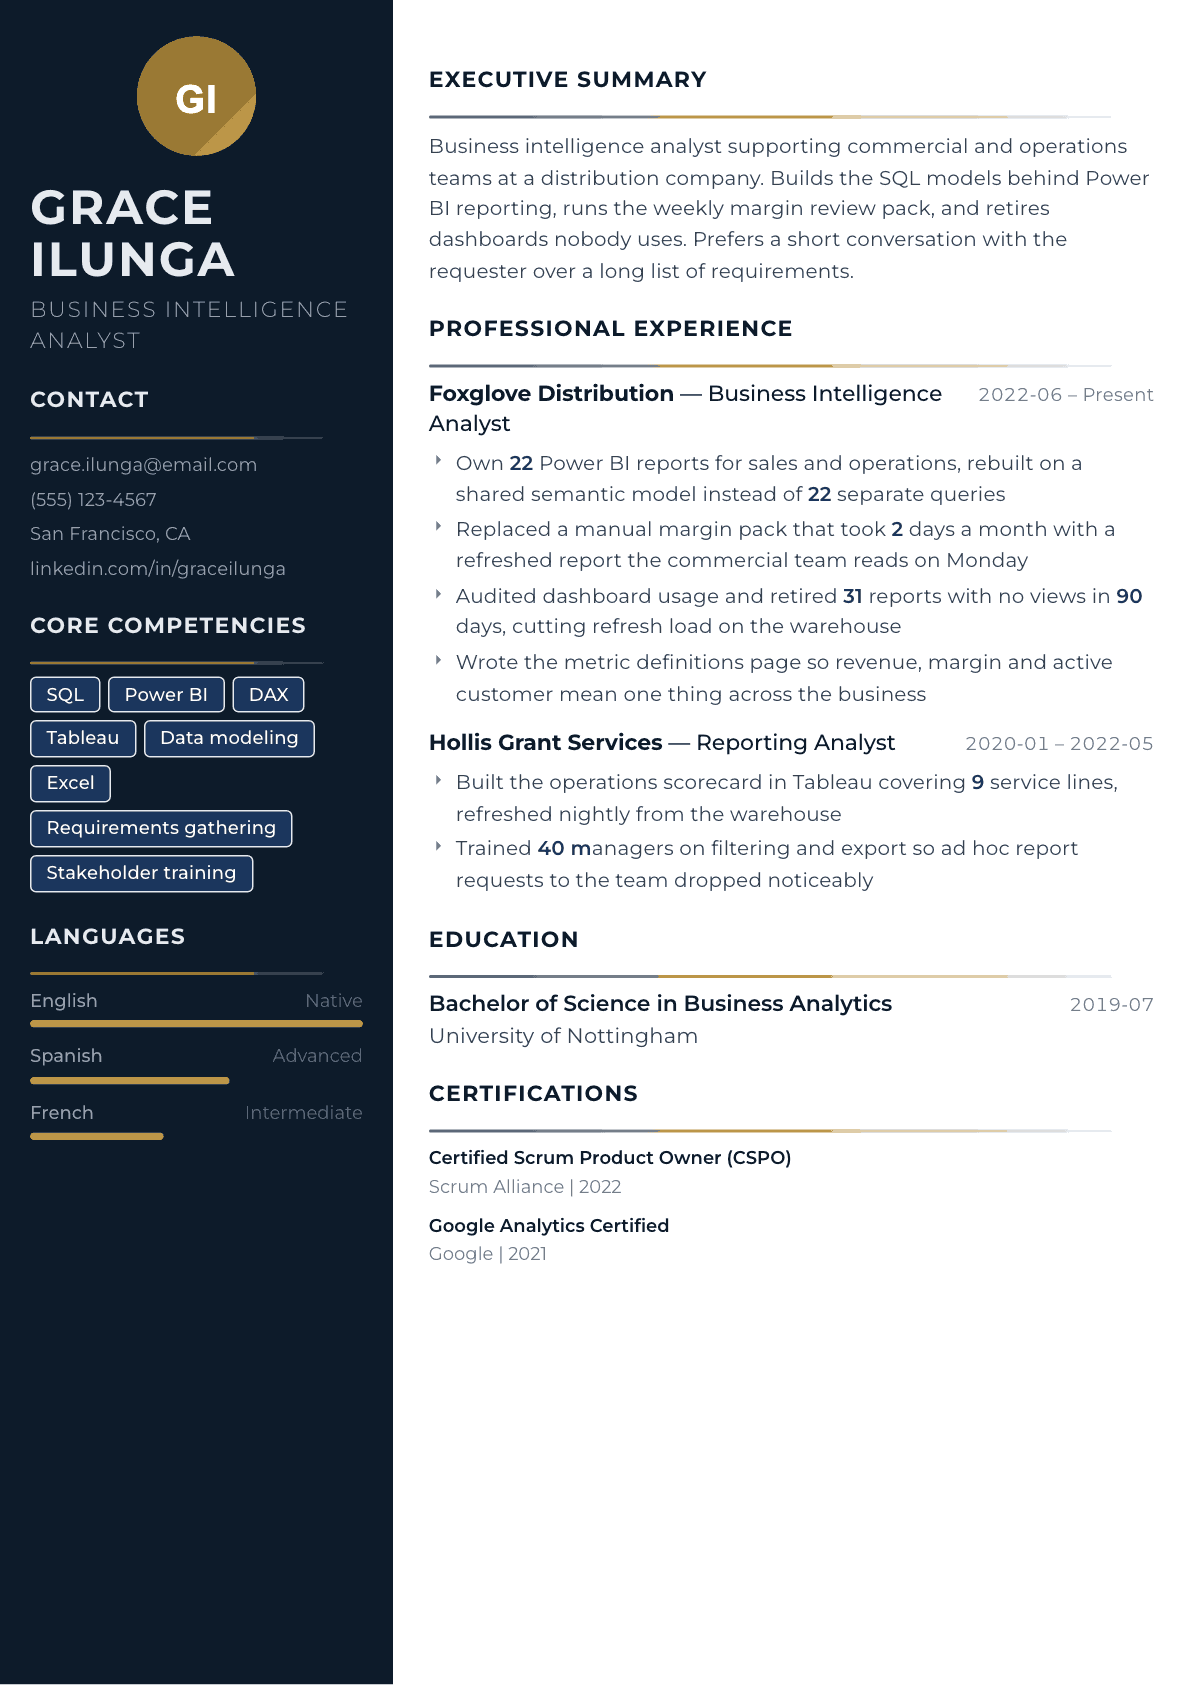
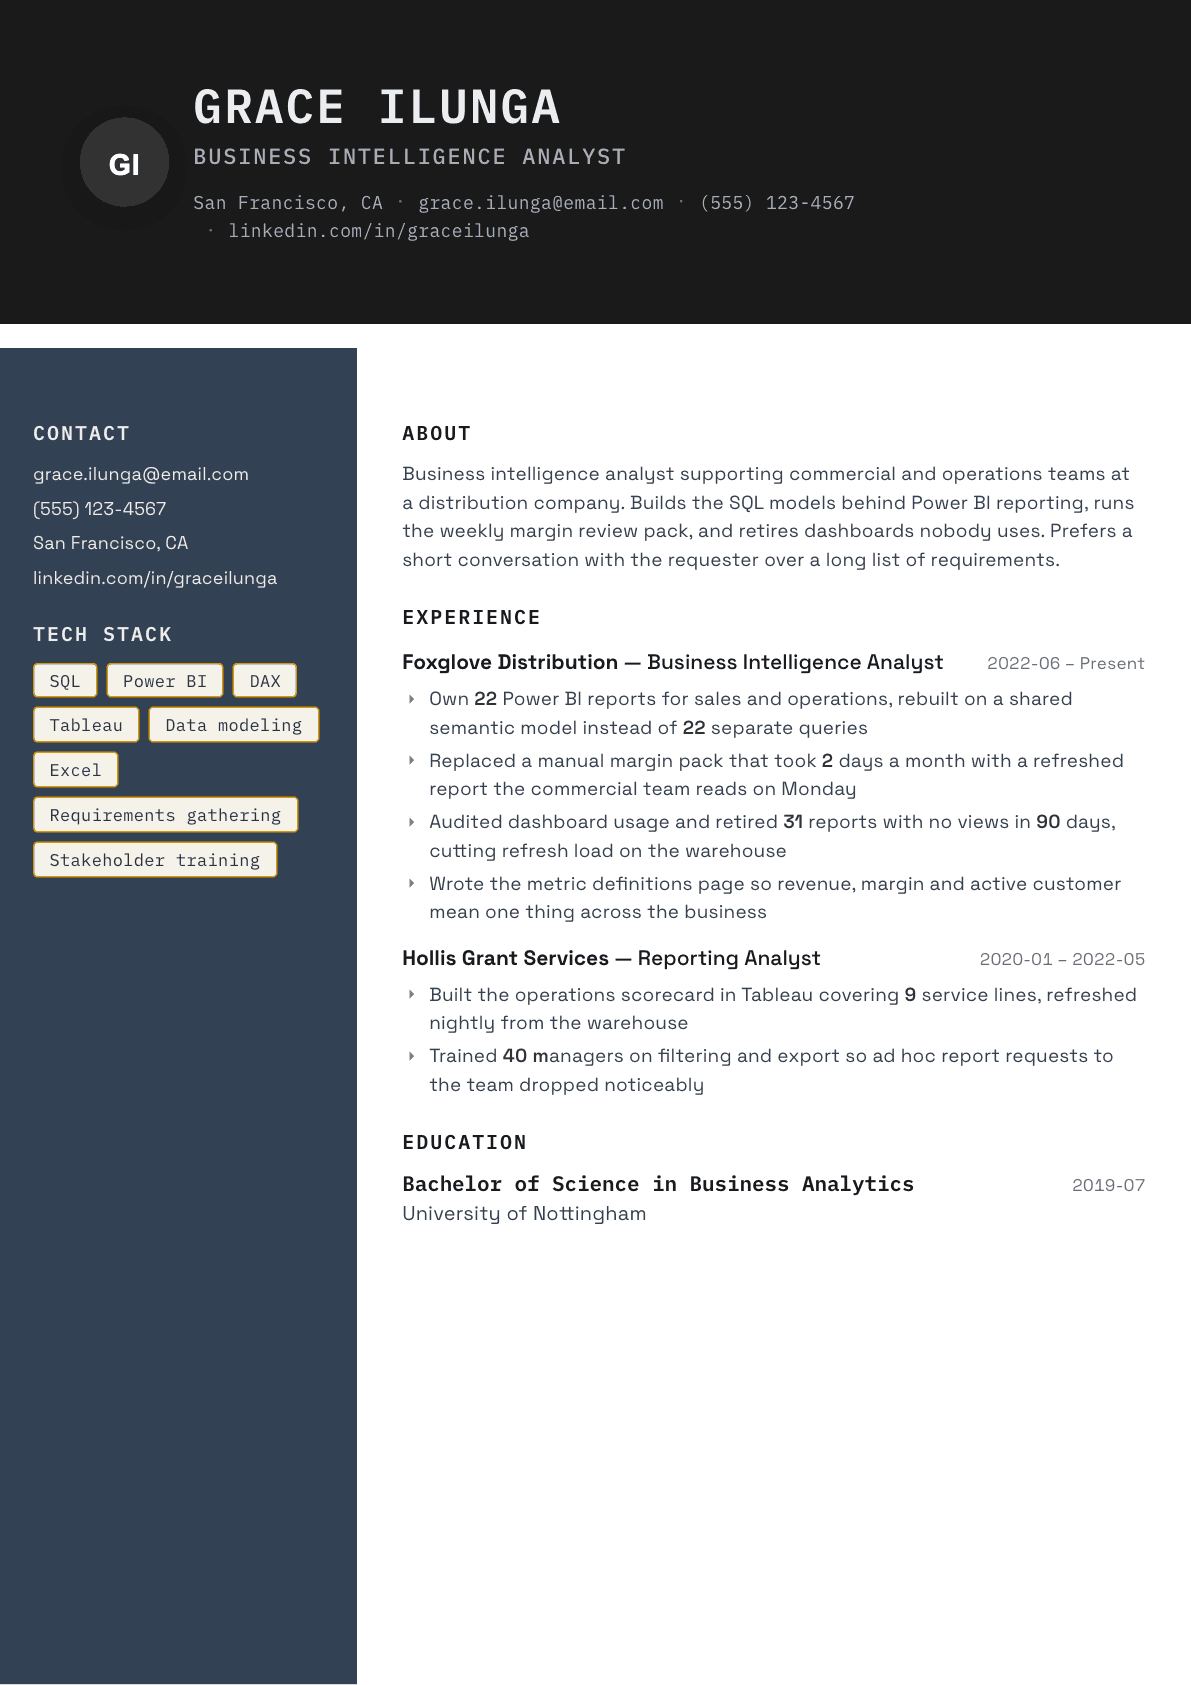
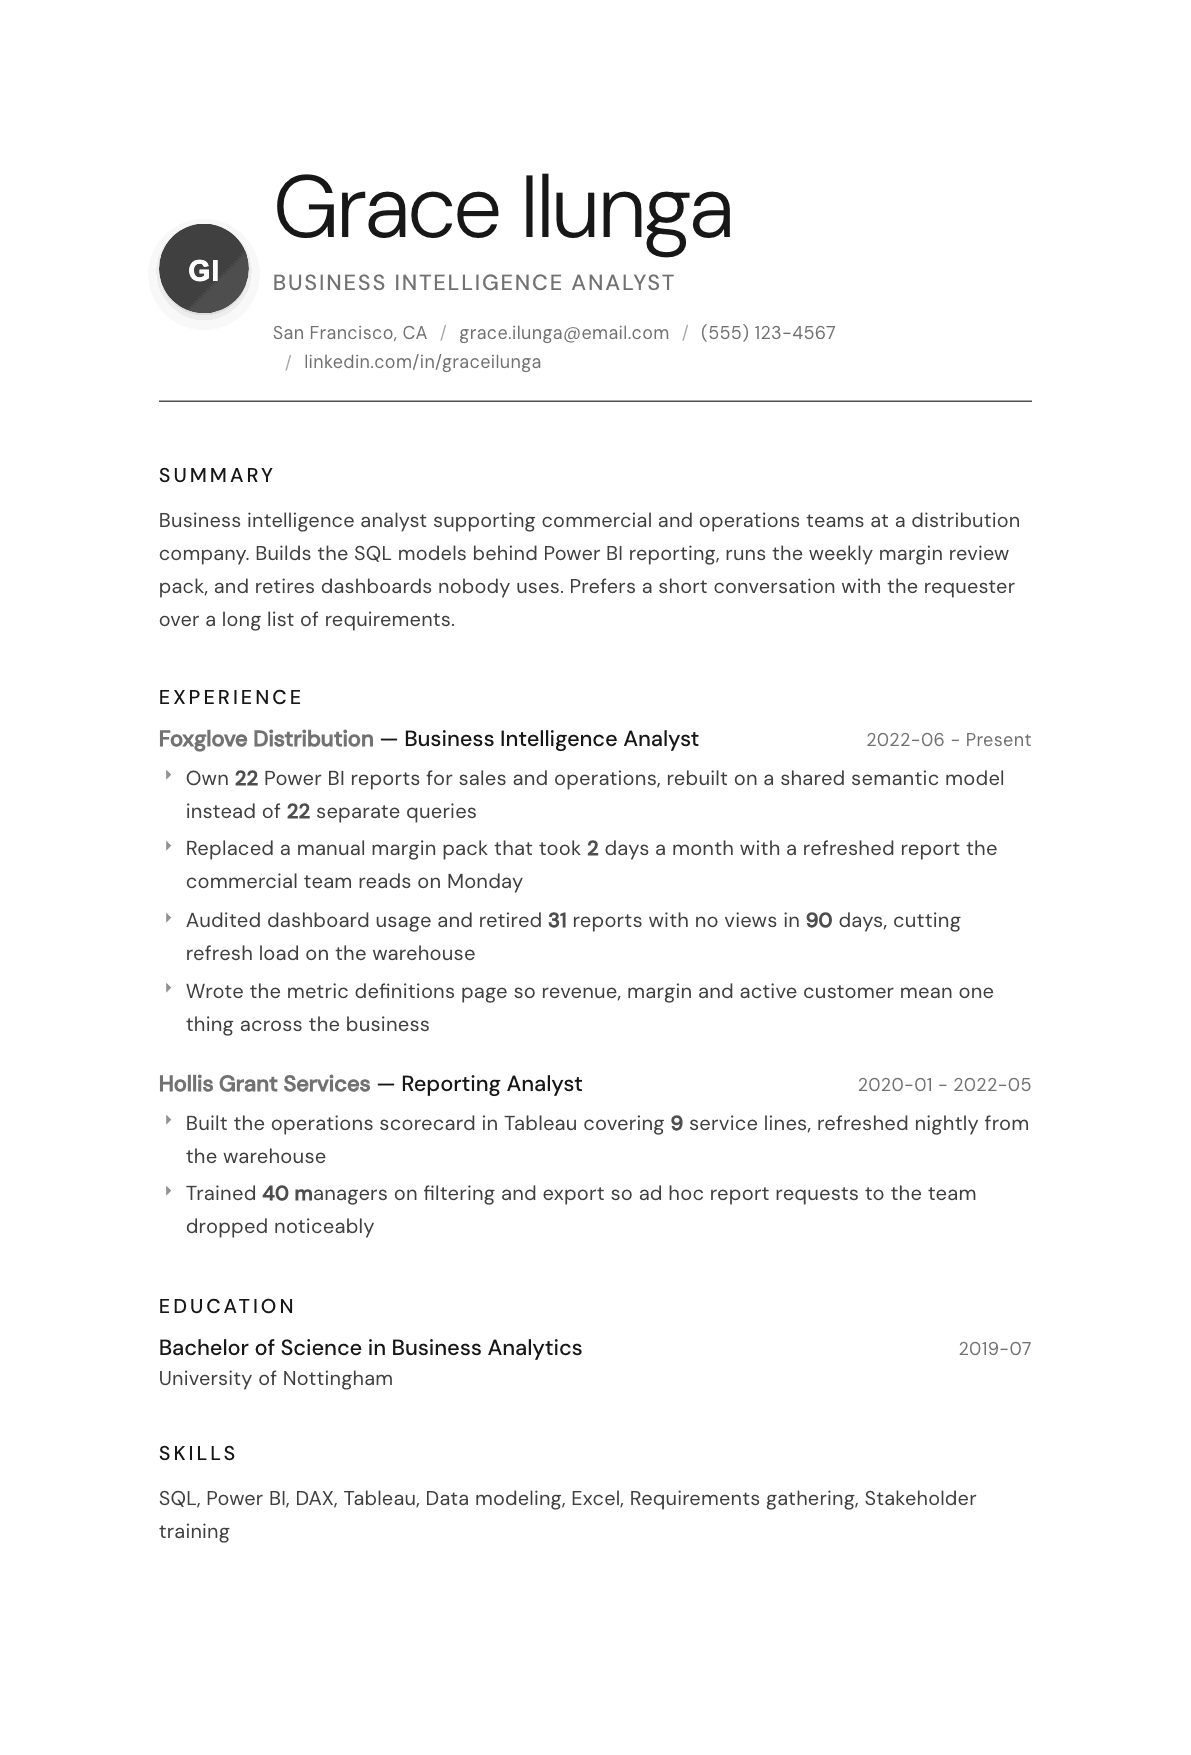
The same business intelligence analyst content laid out in three CVBooster templates, so you can see what the finished document looks like before you write a word.
Example Business Intelligence Analyst summary
Business intelligence analyst with five years supporting commercial and operations teams in distribution and services. Rebuilt a sprawl of separate report queries onto one shared semantic model, replaced a two day manual margin pack with an automated Monday report, and retired dozens of dashboards nobody was opening. Writes the metric definitions that keep revenue and margin meaning the same thing everywhere.
Skills to list on a Business Intelligence Analyst resume
- SQL
- Power BI
- DAX
- Tableau
- Looker
- Data modeling
- Star schema design
- Excel and Power Query
- Requirements gathering
- KPI definition
- Report performance tuning
- Data validation
- Stakeholder training
- Python for analysis
What actually gets this resume read
- Write each bullet around the decision the report changed, not the fact that a dashboard was delivered.
- Name the tool and the modeling layer, such as Power BI with DAX on a star schema or Tableau on extracts.
- Show your SQL depth with window functions, incremental models or query tuning rather than the word advanced.
- Include the housekeeping: metric definitions, retired reports, usage audits and documentation you maintain.
- Say which business function you supported, because finance, supply chain and marketing reporting differ a lot.
- Add one bullet on training or enablement, since business intelligence teams are judged on adoption.
How to write a business intelligence analyst resume
The person hiring a business intelligence analyst usually has a reporting estate that has grown without a gardener. Dozens of dashboards, several definitions of revenue, a finance team that still rebuilds everything in a spreadsheet, and a warehouse creaking under refresh jobs for reports nobody opens. Your resume is being read for evidence that you would tidy that and then keep it tidy.
The trap is writing about output. Built twelve dashboards is a statement about effort, and the hiring manager already has plenty of dashboards. What she does not have is someone who asked why a report was requested, found that two teams meant different things by active customer, and settled it. Reports that changed a decision, and reports you deliberately retired, are the two strongest kinds of bullet on this page.
This guide covers the section order that suits a mixed technical and business role, how to write about SQL depth without the word advanced, how to make dashboard work sound like judgment, and the questions analysts ask when they try to move from reporting into business intelligence properly.
Format: one or two pages, tools visible immediately
Reverse chronological, one page under about six years. Place a tools and techniques block directly under the summary: the reporting platform, the modeling language, the warehouse, and the spreadsheet layer. Postings filter on Power BI, DAX, Tableau, Looker and SQL by name, so those words need to sit somewhere a parser reads cleanly.
Under each role, write one line saying which business functions you supported and how many report consumers there were. Supporting a ten-person commercial team and supporting nine hundred managers across an operation are different jobs even with identical tooling.
- Header: name, city, phone, email, and a link to a public dashboard only if the data is genuinely shareable.
- Order: summary, tools and techniques, experience with a stakeholder line, selected reporting projects, education.
- Never attach a screenshot of internal company data, even blurred.
Summary: the function you serve and the layer you own
Three lines. Name the business areas you report for, the reporting platform, whether you own the modeling layer underneath or only the visuals, and one thing you fixed structurally. Owning the semantic model is a much stronger position than building visuals on someone else data, and readers cannot infer it, so state it.
If you are coming from a pure reporting analyst role, say what you already do beyond building charts: gathering requirements, defining metrics, validating figures against the source, or training users.
Experience: write the decision, not the deliverable
Frame each bullet as a problem, a build and a consequence. A margin pack that took two days a month by hand becomes an automated report the commercial team reads on Monday morning. A scorecard that finally let a service line manager see backlog by region weekly instead of quarterly. The consequence is what tells a hiring manager you understand why anyone wanted the report.
Include the SQL and modeling work explicitly, because business intelligence resumes often read as if the data appeared already clean. Say that you built the shared semantic model, wrote the incremental refresh logic, or replaced twenty separate queries with one conformed model. That is the difference between a report builder and an analyst who can be trusted with the layer beneath.
Keep one bullet per role for governance of the estate: usage audits, retiring unused reports, documenting metric definitions, and setting a naming and certification convention. It is the least glamorous work and the most persuasive.
Show SQL depth by what you did with it
Nobody believes the word advanced. Show it instead: window functions for running totals and cohort logic, common table expressions for readable multi-step transformations, tuning a report query that timed out, or designing a star schema so the reporting tool stops doing joins at render time.
Do the same for the modeling language. In Power BI, that means describing measures written in DAX, a date table, or row-level security you configured. In Looker it means the model files you maintained. Naming the artifact is more convincing than naming the tool.
Keywords and how to place them
These postings recycle a predictable vocabulary: business intelligence, dashboard development, data modeling, semantic model, star schema, key performance indicators, requirements gathering, data validation, self-service reporting, and stakeholder management. Put the platform names in the tools block and the process words inside bullets where the work is visible. A trailing list of soft skills adds nothing that the experience section has not already proved.
Tableau resume: when the job is built around one tool
Some postings are written around Tableau rather than around business intelligence in general, and the job title in the header changes with the employer. Use the exact title from the posting in your header, then make Tableau impossible to miss: name it in the summary, in the tools line, and in at least three bullets that say what you built in it and who used it.
A Tableau focused resume needs proof beyond the dashboard itself: the data sources you connected, the calculations and parameters you wrote, how you published and secured the workbooks on Tableau Server or Tableau Cloud, and how you kept them fast. The written-out example below shows a mid level version. The details are invented; keep the structure.
- Summary: Business intelligence analyst with four years building Tableau dashboards for a regional logistics company, from the SQL extract to the published workbook. Owns the delivery performance and fleet cost dashboards used in the weekly operations review, and trains depot managers to filter and export their own views.
- Tools line: Tableau Desktop, Tableau Server, Tableau Prep, SQL Server, Snowflake, Excel, calculated fields, level of detail expressions, parameters, row level security, extracts and refresh schedules.
- Bullet: Rebuilt the delivery performance dashboard from twelve separate workbooks into one, with a depot parameter and row level security, so each depot manager sees only their own routes.
- Bullet: Moved slow live connections to scheduled extracts and reduced the calculated fields in the main view, cutting load time enough that the operations team stopped exporting to Excel before meetings.
- Bullet: Wrote the SQL views behind the fleet cost dashboard with the finance team and documented every measure definition on a single page linked from the workbook.
Business Intelligence Analyst resume summary examples
Two years reporting
Reporting analyst with two years building Power BI dashboards for a services operation, moving into full business intelligence work. Writes the SQL behind my own reports, rebuilt the weekly utilization pack on a shared date table, and trained twelve managers to self-serve rather than requesting exports.
Five years in
Business intelligence analyst supporting commercial and operations teams at a distribution company. Owns 22 Power BI reports on one shared semantic model, replaced a two day manual margin pack with an automated Monday report, and maintains the metric definitions page the whole business now works from.
Lead analyst
Lead business intelligence analyst for a group finance function, setting the certification standard for reports and mentoring three analysts. Consolidated regional reporting onto one conformed model, retired a third of the report estate after a usage audit, and cut warehouse refresh load noticeably as a result.
Work experience bullets: before and after
Before: Created dashboards for the sales and operations teams.
After: Own 22 Power BI reports for sales and operations, rebuilt on one shared semantic model rather than 22 separate queries, so a metric change now happens in one place instead of twenty-two.
The structural change and its maintenance benefit show design thinking rather than a count of deliverables.
Before: Automated a manual monthly report.
After: Replaced a margin pack that consumed 2 days of analyst time every month with a refreshed report the commercial team reads on Monday morning, validated against the finance ledger for three cycles before handover.
The time recovered plus the validation period shows the automation was trusted, not just faster.
Before: Cleaned up old reports.
After: Audited dashboard usage and retired 31 reports with no views in 90 days, which cut scheduled refresh load on the warehouse and removed a source of contradictory figures.
Removal with a stated criterion is judgment, and the reader sees two benefits from one decision.
Before: Worked with stakeholders to gather requirements.
After: Ran short scoping conversations with report requesters that surfaced two different definitions of active customer, then wrote the definitions page that both finance and sales agreed to work from.
A concrete conflict resolved is far stronger evidence of requirements skill than the phrase gathering requirements.
Before: Used SQL to extract and analyze data.
After: Rewrote the operations scorecard query using window functions and a pre-aggregated table, taking a report that timed out at nine minutes down to a load under twenty seconds.
A named technique and a runtime result demonstrate SQL depth that the word advanced never proves.
Hard skills
- SQL including window functions
- Power BI and DAX
- Tableau
- Looker
- Dimensional and semantic modeling
- Excel and Power Query
- Data validation and reconciliation
- Key performance indicator definition
- Report performance tuning
- Requirements gathering
- Row-level security configuration
- Python for ad hoc analysis
Soft skills
- Asking why a report is wanted
- Explaining numbers to non-technical readers
- Managing competing requests
- Training and enablement
- Saying no to a report that should not exist
Certifications worth listing
- Microsoft Certified: Power BI Data Analyst Associate (PL-300) (Microsoft)
- Tableau Certified Data Analyst (Tableau)
- Google Data Analytics Professional Certificate (Google)
- SnowPro Core Certification (Snowflake)
Mistakes that cost business intelligence analyst candidates the interview
- Counting dashboards built as if volume were the achievement, when the manager already has too many dashboards.
- Never mentioning the modeling layer, so a reader assumes you only build visuals on someone else data.
- Claiming advanced SQL without a single example of a window function, a tuning fix or a schema you designed.
- Leaving out the business function you supported, when finance, supply chain and marketing reporting differ sharply.
- Omitting adoption and training, which is how business intelligence teams are actually judged internally.
- Attaching screenshots of internal dashboards, which raises a confidentiality flag before anything else is read.
Business Intelligence Analyst resume questions
What is the difference between a business intelligence analyst and a data analyst resume?
A business intelligence resume centers the reporting estate: semantic models, dashboards, metric definitions and adoption. A data analyst resume centers investigation and answers to specific questions. If a posting mixes both, lead with whichever the job description spends more words on.
How do I prove my SQL is strong on a resume?
Show the artifacts. Window functions used for cohort or running total logic, a query rewritten to fix a timeout, a star schema you designed, or incremental refresh logic you wrote. One concrete example beats any self-assessed skill level.
Should I list both Power BI and Tableau?
List both if you have genuinely built in both, with the stronger one first and named inside a bullet. If one is only classroom exposure, leave it out. Interviewers frequently ask a candidate to talk through a build in whichever tool they listed.
Can I include screenshots or a portfolio of dashboards?
Never with real company data. Build a portfolio on public datasets instead, and link it. The portfolio should show the model behind the report, not only the visuals, because the modeling is what a hiring manager cannot assess from a picture.
How do I move from a reporting analyst role into business intelligence?
Emphasize the work that is already adjacent: writing your own SQL, defining metrics, validating numbers against source systems and training users. Then take one structural project, such as consolidating reports onto a shared model, and make it the centerpiece of the page.
Related resume examples
- Data Analyst Resume example
- Financial Analyst Resume example
- Analytics Engineer Resume example
- Power BI Developer Resume example
- GIS Analyst Resume example
- SQL Developer Resume example